Scale Your Data Intelligence

Your data speaks.
We scale it into decisions.

Unified dashboards, conversational AI, financial reporting and enterprise governance. One platform to scale every analysis in your company.

Scalar Analytics
Dashboards
AI Builder
Chat AI
SpotIQ
Automation
P&L
Revenue 0 +12.5%
Active Clients 0 +8.1%
AI Queries / mo 0 +23%
SQL Accuracy 0 +2.1%

Monthly Revenue

12 months

By Channel

4 channels
Online Retail B2B Partners
AI Conversational Analytics
What was the revenue by region last quarter?
guided wizard

Create with AI

4-step flow
Revenue 360 Semantic ready
Description + semantic mapping validated
Revenue by channel bar
Monthly trend line
Top 5 sellers rank
AI Conversational Analytics Auto
Show me the top 5 products by revenue this quarter
SQL SELECT product, SUM(revenue) ... GROUP BY 1 ORDER BY 2 DESC LIMIT 5
ProductRevenue%
Enterprise SuiteR$ 842K34%
Analytics ProR$ 621K25%
Data ConnectR$ 418K17%
Basic PlanR$ 312K13%
API AccessR$ 267K11%
Enterprise Suite leads with 34% share, up 12% from last quarter. Consider expanding this product line.
What's the trend for the last 6 months?
Ask anything about your data...

SpotIQ

Analyzing
!
Revenue Anomaly Detected

Southeast region revenue dropped 23% vs. expected trend. Investigate supplier delays.

Feb 27, 2026 Anomaly
Positive Trend: Online Channel

Online sales growing 18% MoM for 4 consecutive months. Projected to surpass Retail by Q3.

Feb 26, 2026 Trend
Correlation: Marketing Spend × Leads

Strong correlation (r=0.87) between digital marketing investment and lead generation in the last 90 days.

Feb 25, 2026 Correlation

Data Pipelines

3 Active
CRM → Data Warehouse Extract clients, contacts, deals • Every 6h
72%
ERP → Financial Tables Revenue, costs, GL entries • Daily 02:00
100%
API → Marketing Metrics Google Ads, Meta, LinkedIn • Every 2h
45%
CSV → Product Catalog Upload and merge product data • Manual
Scheduled

P&L Statement

Jan 2026 Feb 2026 YTD
Gross Revenue R$ 4.820.000 +15.2%
(-) Deductions & Returns R$ -482.000 +3.1%
Net Revenue R$ 4.338.000 +16.0%
(-) Cost of Goods Sold R$ -1.735.200 +8.5%
Gross Profit R$ 2.602.800 +21.3%
(-) Operating Expenses R$ -1.561.680 +5.7%
EBITDA R$ 1.041.120 +28.4%
0

Query Accuracy

AI-generated queries validated in real time
0

Faster Answers

Compared to traditional BI report building
0

Built-in Functions

Expressions, calculations, and transformations
0

Languages

Full platform in Portuguese, English, and Spanish
PLATFORM

One platform.
Scale every analysis.

From real-time dashboards to financial reporting, Scalar Analytics replaces a fragmented toolset with a unified, governed experience that scales with your business.
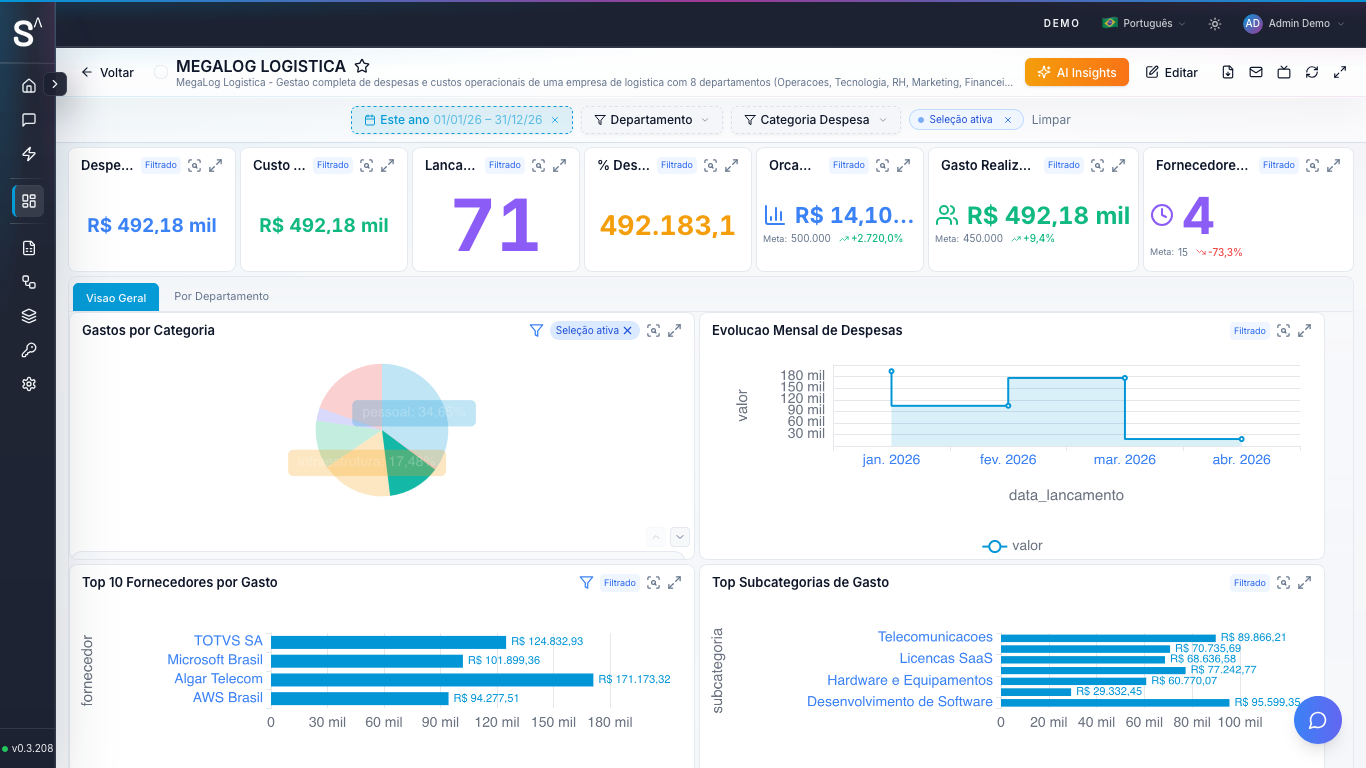
Unified Dashboards

Interactive dashboards, automation-powered data views, and custom widgets in a single view. Scalar Analytics automatically adapts each dashboard for mobile and desktop, so teams do not need separate versions. Version history, PDF export, scheduled email delivery, TV mode for presentations, and full visual customization. Now includes AI-generated first drafts based on dataset semantic context.

InteractiveAutomationPDF ExportScheduled EmailTV Mode

Conversational AI

Ask questions in plain language and get answers, charts, and executive summaries in seconds. Voice input, conversation memory, and continuous learning from your team's feedback.

Automated Insights

Proactive anomaly detection, trend monitoring, and opportunity discovery. The platform watches your data 24/7 and alerts you to what matters before you need to ask.

Semantic Layer

The AI automatically understands your data structure and business terminology. Visual relationship mapping, approval workflows, and continuous learning from your team's context.

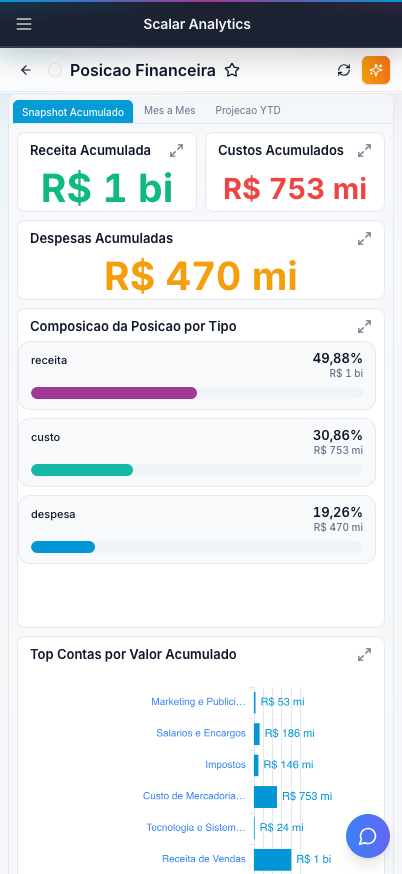
P&L Financial Module

Complete financial reporting: chart of accounts, budget planning, scenario comparison, period close, ERP integration, and AI-generated financial insights.

Advanced Datasets

Live queries, scheduled data snapshots, and combine datasets with flexible joins and unions. Powerful expression engine for custom calculations across any database.

Governance & RLS

Each user sees only the data they are authorized to access. Row-level security, role-based permissions, complete audit trail, and LGPD/GDPR compliance ensure total control over who sees what, when, and how.

FOUR-TAB STRUCTURE

A simpler navigation.
A stronger story.

Home now works as the overview layer. The deeper product, security and commercial details live in dedicated pages designed for focused exploration.

AI Dashboard Creator

AI Dashboard Creator

Show how Semantic Mapping and dataset descriptions become a guided first draft instead of a blank builder.

  • 4-step wizard with dataset checks
  • AI-suggested widgets, tabs and filters
  • Copilot refinements in natural language
Open AI Dashboard Creator
Security & Compliance

Security & Compliance

Give technical buyers a cleaner path to evaluate governance, privacy and operational controls without crowding the home page.

  • RLS, permissions and audit trail
  • LGPD/GDPR-ready privacy controls
  • Impersonation and AI governance visibility
Open Security & Compliance
Pricing & Services

Pricing & Services

Keep plans and service packaging in one place so commercial conversations can go deeper without turning the homepage into a rate card.

  • Software plans for different growth stages
  • Professional services separated by scope
  • Clear path to demo or consulting conversation
Open Pricing & Services
REAL PRODUCT DEMO

See Scalar Analytics in action

The same Scalar Analytics dashboard, automatically adapted for mobile and desktop.

Switch demo theme
Real Scalar Analytics dashboard demonstration
Scalar Analytics mobile dashboard preview

Ready to scale your analytics?

Schedule a personalized demo and see how Scalar Analytics replaces your fragmented BI toolset with a single, intelligent platform.

Free technical assessment Personalized demo Privacy-ready environment Full data governance